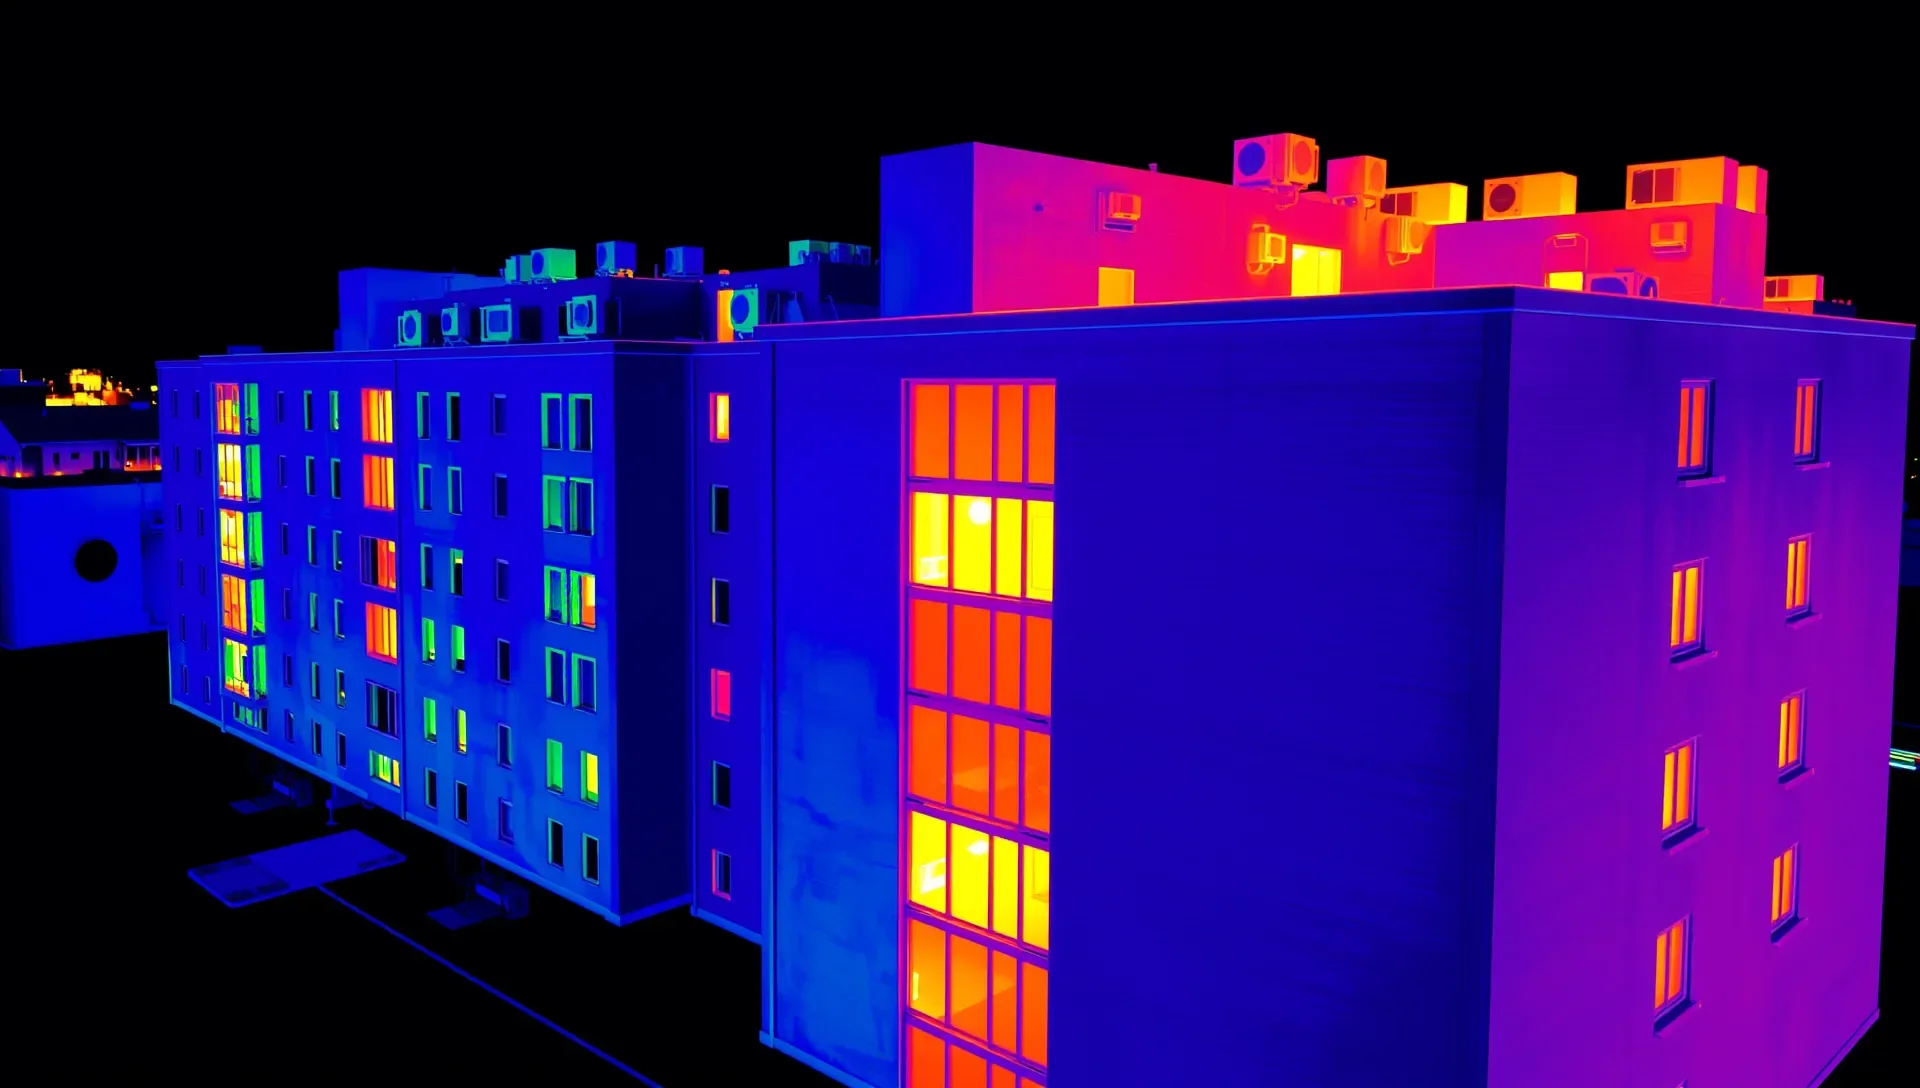
Diagnose Before Prescribing
Building Intelligence
A structured assessment of what is actually happening in your building before you spend money on it. Not a sales pitch for upgrades — a clear picture of current conditions, options, and tradeoffs.
The Problem
Fixing one thing at a time rarely improves the bigger picture.
Most commercial buildings deal with a combination of aging systems, rising costs, and recurring issues. Without a complete picture, decisions get made one at a time — replacing equipment that could have waited while ignoring systems that are quietly costing thousands a year. Building Intelligence identifies what matters most and what can wait.
15+
Industries assessed and served
Nationwide
Licensed electrical contractor of record
2015
Assessing buildings since
What We Look At
Six layers of systems intelligence.
Each layer goes a level deeper than a standard PCA — from what’s installed to what will pass an insurer’s review. Not every engagement uses all six; we scope to what the decision requires.

Physical systems reality
What is actually installed, what condition it is in, and what is reaching end of life. Electrical, HVAC, lighting, and controls inspected and documented with photos.
Measurement, not estimates
Temporary data loggers on circuits, panels, and mechanical systems. Real consumption data from your building — not nameplate ratings or database averages.
Infrastructure mapping
Single-line diagrams, zone maps, and organized photo libraries. A complete record of how systems connect, where capacity exists, and where it does not.
Incentive & rebate identification
Every available utility rebate, tax credit, and stacking strategy identified by property and utility territory before you commit capital.
Climate & environmental stress
Heat, humidity, freeze/thaw, storm exposure, and wildfire risk mapped against equipment degradation. Region-specific factors that generic assessments miss.
Safety & compliance review
Arc-flash hazard documentation, grounding verification, code compliance check, and safety findings formatted for underwriters and insurers.
The deliverable
A report you can act on.
Every finding tagged by severity and capital exposure. Sequenced into phases you can actually execute on. Formatted so underwriters, lenders, and insurers can read it without a translator.
How it works
Four steps from a site walk to a report you can act on.
Every engagement follows the same four steps — scope, assess, analyze, deliver — so you know the timeline, the deliverables, and the fee before any work begins.
- Step 01
Scope
We define what the assessment needs to cover based on your decision — acquisition, disposition, capital planning, or efficiency evaluation. Full fee quoted upfront.
- Step 02
Assess
Licensed electricians walk the site. Every panel, fixture, and system documented. Data loggers installed if metering is needed. Photos organized by zone.
- Step 03
Analyze
Findings scored by urgency and cost. Savings quantified against current spend. Incentive opportunities mapped. Capital forecast built at 1, 3, and 5 years.
- Step 04
Deliver
Client-ready report with executive summary, prioritized action items, and clear options: what to do now, what to plan for later, and what may not be necessary at all.

When to Use It
Different decisions. Same rigor.
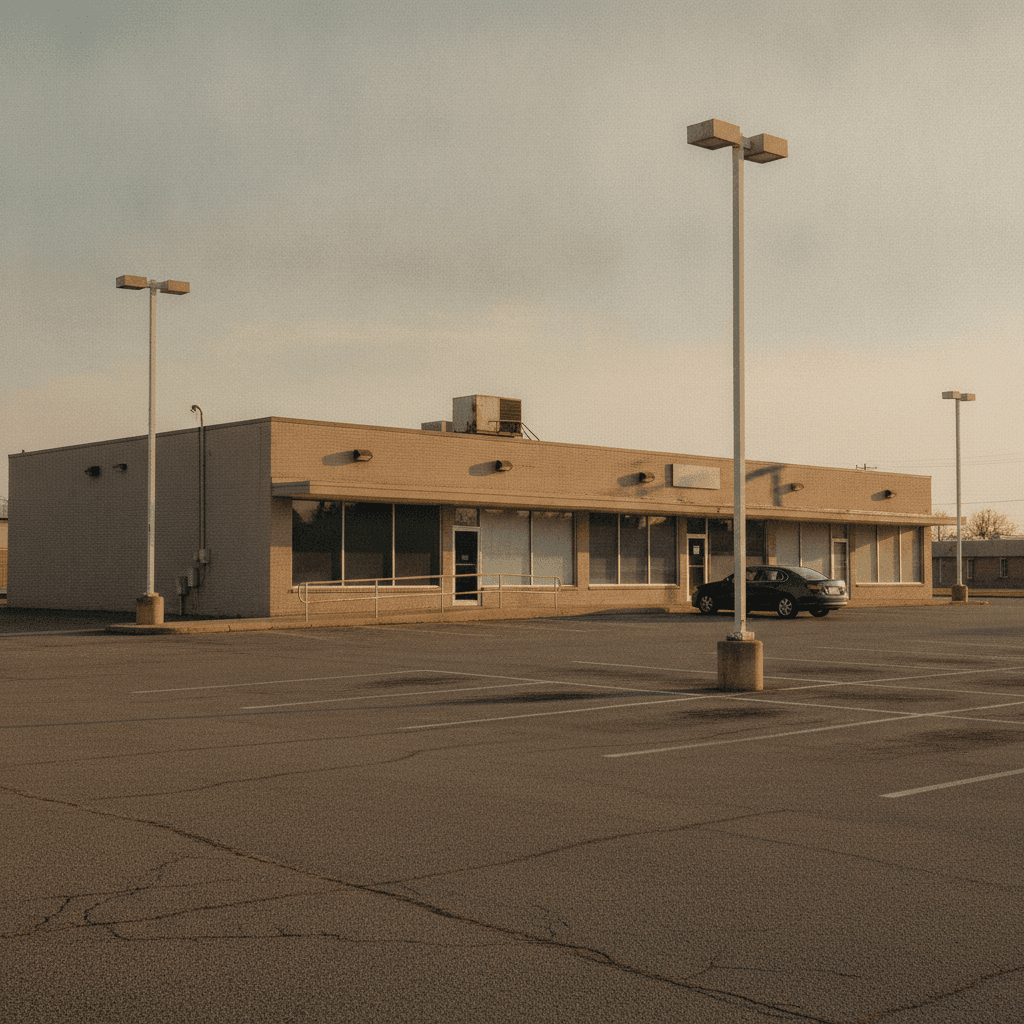
Before acquisition.
Know what you are buying. Identify deferred maintenance, quantify capital exposure, and map savings opportunities before you close.
- Deferred maintenance and capital exposure documented
- Savings opportunity quantified against current utility spend
- Available incentives mapped by property and utility
- Findings formatted for negotiation leverage
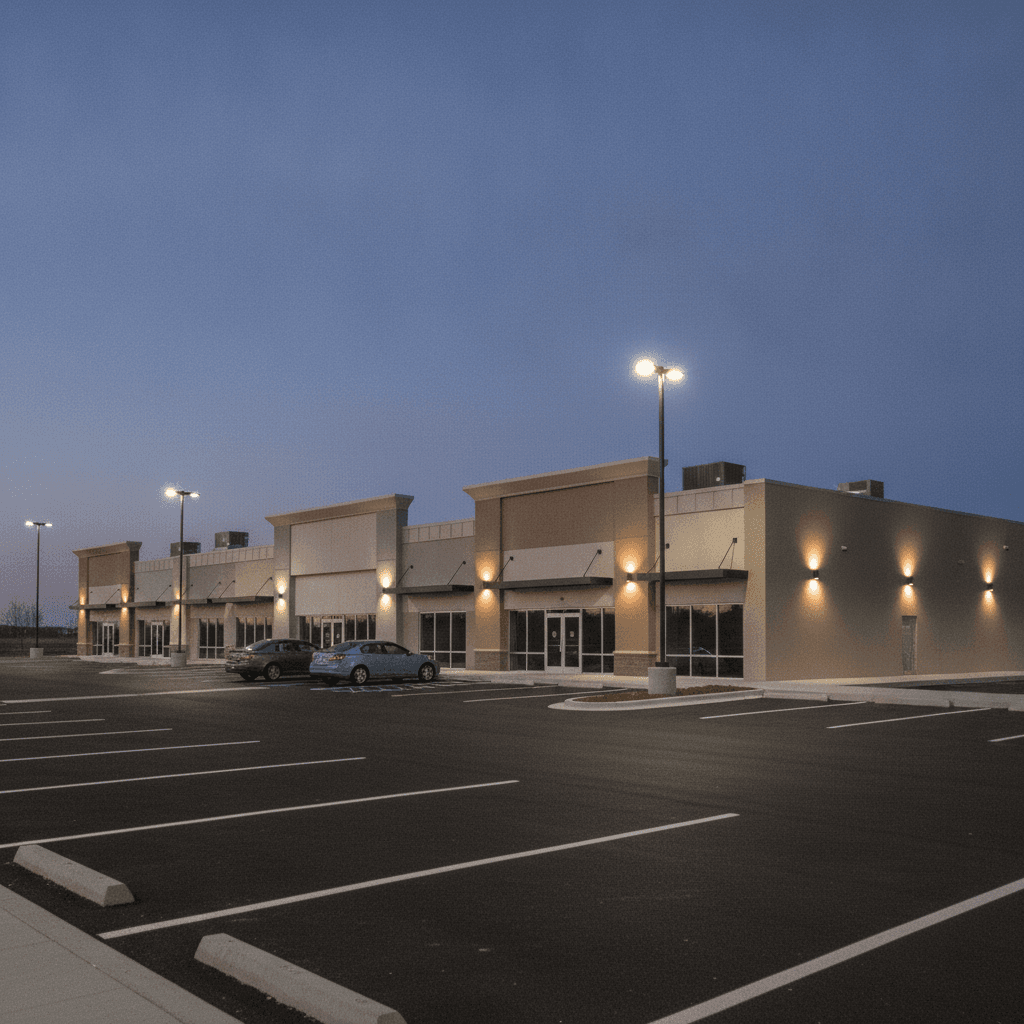
Before disposition.
Prove system health and recent upgrades to buyers. Reduce due diligence friction and protect your asset value during sale.
- Current system condition and recent upgrades documented
- Energy and maintenance performance quantified
- Asset-ready systems summary for buyer review
- Fewer surprises in the buyer's own diligence process
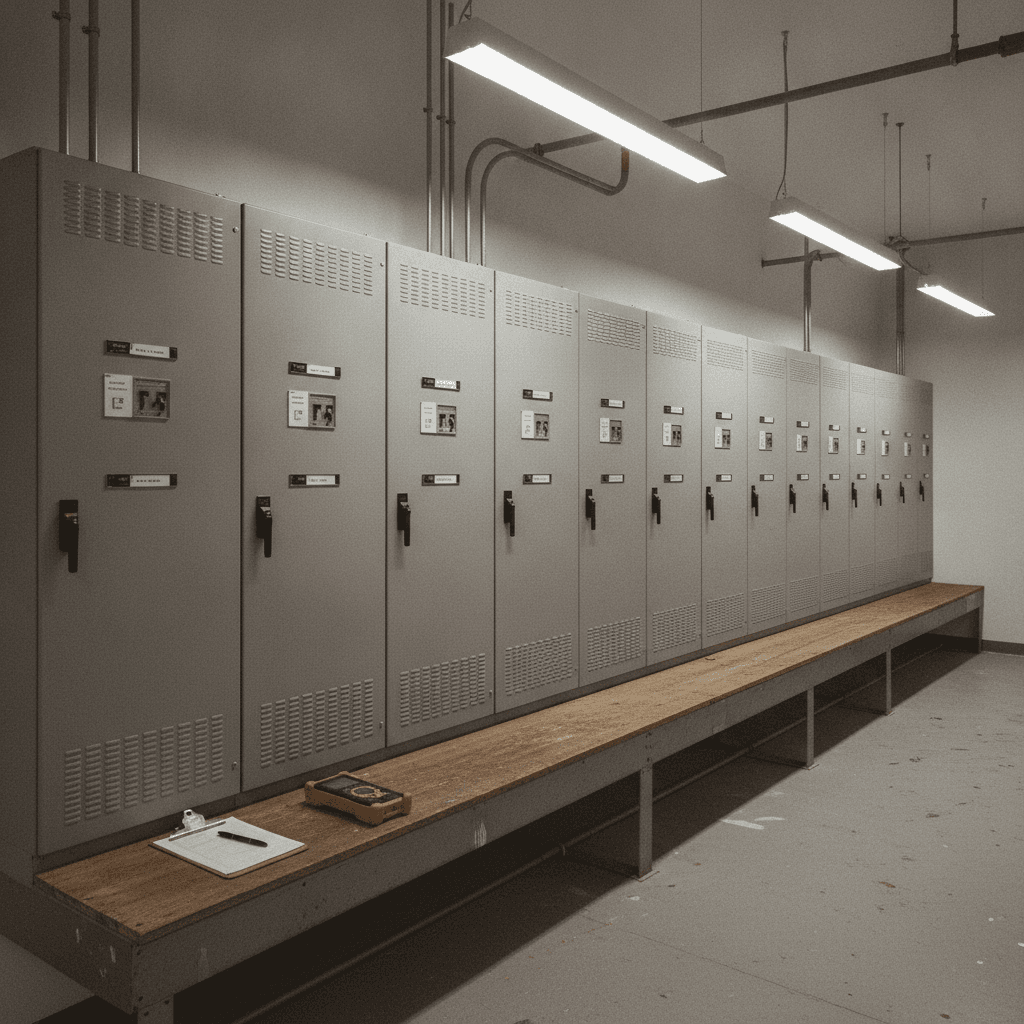
Before capital investment.
Prioritize where to spend and where to hold. Build a capital forecast grounded in data, not vendor proposals.
- Equipment scored by age, condition, and urgency
- 1/3/5-year capital roadmap with cost estimates
- Repair-vs-replace analysis on major systems
- Rebate and financing options identified upfront
The Deliverable
A report that makes the decision easier.
Every engagement produces a client-ready document that organizes findings into clear options. Formatted for ownership, asset management, and capital partners.
- Executive summary with prioritized recommendations
- Prioritized capex forecast at 1, 3, and 5 years
- Energy performance analysis with dollar savings
- Risk register with probability and impact scoring
- Rebate and incentive opportunity map
- Organized photo library by zone and system
- Equipment condition scoring (green/yellow/red)
- Formatted for lender, insurer, and ownership review
Fee Credit
Assessment fees credited against project work.
If you move forward with a retrofit or electrical project within 6 months of the assessment, we credit the full assessment fee against the project cost. The intelligence work becomes free if you do the work.
ESG & GRESB Reporting Support
Meter-verified data your sustainability team can actually submit.
ESG reporting is only as good as the underlying utility data. Modeled numbers and default factors do not survive a GRESB scoring committee or an LP diligence review. Our assessments and install deliverables are structured to produce the evidence chain sustainability teams need — asset-level consumption, measured reductions, and submeter-clean tenant vs. common-area splits.
Asset-level utility consumption data (ALDC)
Meter-verified kWh and kW by property, formatted for the GRESB Real Estate module. No modeled figures — actual utility feeds tied to the specific asset.
Submeter installation + integration
Physical submeters that separate tenant loads from common-area loads. Cleaner CAM reconciliation, accurate tenant billing, and evidence for GRESB tenant-engagement scoring.
Measured reduction reports per project
Baseline vs. post-install kWh reduction tied to specific scope, retained through the asset hold period. Auditable evidence for Scope 2 emissions accounting.
Rebate + incentive documentation trail
Every utility rebate and applicable federal or state tax incentive documented in a persistent evidence package — for tax lines, ESG line items, and sustainability disclosures.
Verification methodology one-pager
Independent M&V protocol described in one page, defensible under third-party review. Available on request for LP disclosures and sustainability audits.
Portfolio dashboard access
Multi-property view of consumption, verified savings vs. proposal target, and rebate capture status by market — sortable, exportable, ownership-ready.
We do not sell an ESG platform. We produce the evidence your existing platform needs — matched to how GRESB, SASB, and CDP actually score commercial real estate portfolios.
Part Two
The other half of the job — after the retrofit.
The audit tells you what your building needs. Preventive maintenance is how we prove it stays that way. Scheduled inspections, verified savings, and one team accountable for the electrical infrastructure long after the last fixture goes in.
Live operations
We watch your property so you don’t have to.
Utility meters, runtime schedules, and coincident-peak events surface in one place. When something drifts from spec, we see it, log it, and correct it before it becomes a bill you did not budget for.
Every savings dollar is measured, not modeled.
Every property in the portfolio is tracked against what we promised at proposal. Utility feeds sync directly. When your numbers drift, we see it before you do.
IllustrativeRepresentative view of the internal verification dashboard we use to track measured savings across the portfolio. Property names and values are anonymized for public display.
The Problem
Reactive maintenance costs more and fixes less.
Without a structured plan, electrical systems are only addressed when something breaks. That means higher costs, more disruption, and rushed decisions about equipment that should have been replaced months ago. A preventive approach catches problems early — when they are cheaper and easier to fix.
Every Month
Scheduled attention. Documented results.
Each monthly visit follows the same structured checklist. The same licensed technician walks every fixture, tests every safety device, and delivers a written report before they leave.
Lighting inspection and repair
Walk every fixture. Replace outages. Verify controls, photocells, and timeclocks are operating on schedule.
Panel and equipment inspection
Check electrical rooms, distribution boards, and breaker panels for overheating, corrosion, or loose connections.
Emergency lighting test
Functional test of all emergency lights and exit signs. Battery verification. Results documented for compliance.
Load and circuit review
Scan for overloaded circuits, unbalanced phases, and breakers running warm. Redistribute loads before trips happen.
Safety device testing
GFCI outlets, surge protectors, and safety switches tested and documented. Non-functional devices replaced on the spot.
Site performance report
Written summary of every task, finding, and corrective action. Delivered digitally after each visit.
Every Quarter
Deeper diagnostics. Ownership-ready reporting.
Infrared thermography scan
Thermal imaging of panels, switchboards, and critical connections to catch hot spots before they become failures.
Generator and backup power test
Load test or simulated power failure. ATS verification. Voltage, frequency, and alarm documentation.
Comprehensive panel inspection
Bus bars, breaker mountings, and cable terminations checked with covers removed. Connections torqued to spec.
Quarterly ownership report
Compiled findings, thermal images, test results, and recommended actions. Formatted for asset management review.
Every Year
Full audit. Capital roadmap. No surprises next year.
Full-system audit
Top-to-bottom inspection of every panel, switchgear section, transformer, disconnect, and visible conduit run.
Switchgear preventive maintenance
Coordinated downtime for intrusive maintenance. Bus cleaning, connection torquing, breaker exercising, relay testing.
90-minute emergency lighting test
Full drain test per life safety code. Batteries and units that fail are replaced and documented.
Capital planning roadmap
3/5/10-year capital forecast based on equipment age, condition scoring, and replacement cost projections.
Emergency Response
When something breaks, we already know your building.
Performance plan clients get priority response from a team that already understands their systems. No explaining your building to a new vendor. No waiting for someone to figure out your panel schedule.
Priority dispatch
Plan clients go to the front of the line. Licensed electricians dispatched ahead of non-contract calls.
One call, not three
We already have your site documentation, panel schedules, and equipment history. No onboarding a stranger.
Incident documentation
Every emergency response documented with cause, fix, and recommendations to prevent recurrence.
Portfolio Scale
Same standard. Every property. Every visit.
For multi-site portfolios, we apply the same inspection protocol, reporting format, and equipment standards across every property. One team managing electrical performance across your entire portfolio — not a different vendor at every location with different standards and different paperwork.
- Standardized inspection checklists across all sites
- QR-coded asset tracking on every fixture
- Consistent reporting format for ownership review
- Specification governance for tenant work oversight
- Rebate and incentive capture across the portfolio
- Single point of contact for all electrical needs
Scope Clarity
Clear boundaries. No scope creep.
Priced separately when you need them.
Performance plans cover inspection, monitoring, and covered repairs. The following are scoped and quoted independently so you only pay for what you actually need:
- Capital equipment replacement
- New construction or tenant build-out wiring
- EV charging infrastructure
- Major retrofit projects
- One-time engineering studies
- Emergency dispatch outside plan hours
Questions we get on building assessments and performance plans.
Who is this for?
Property owners evaluating capital investments, acquisitions teams doing buy-side diligence, sellers preparing assets for disposition, and portfolio managers evaluating efficiency opportunities across multiple properties.
How long does it take?
Single property: 5 to 10 business days from walk-through to delivered report. Portfolio-wide engagements (10+ properties): 3 to 6 weeks depending on geographic distribution and depth of assessment.
How is this different from a standard property condition assessment?
Standard PCAs catch obvious deficiencies like a 25-year-old roof or end-of-life HVAC. Our assessment also catches what quietly eats margin: undersized panels, failing controls, missing rebate programs, mismatched lighting creating liability, and arc flash compliance gaps. We quantify dollar impact on every finding.
What does the report look like?
Executive summary, prioritized capex forecast (1/3/5 year), energy performance analysis, risk register with probability and impact scoring, rebate opportunity map, equipment condition scoring, and organized photo library. Formatted for ownership, lenders, and insurers.
Can the assessment fee be credited against future work?
Yes. If you engage us for an assessment and then move forward with a retrofit or electrical project within 6 months, we credit the full assessment fee against the project cost.
Do you assess just lighting, or full building systems?
We scope to the decision. Some assessments focus only on lighting and controls. Others cover full electrical infrastructure, mechanical systems, and capacity planning. The scope is agreed before the walk-through starts.
Why a performance plan instead of calling when something breaks?
A plan means someone is watching your building between calls. Scheduled inspections, thermal scans, and trend analysis catch problems early when they cost less to fix. Reactive-only maintenance means you are always behind, always paying emergency rates, and always making decisions with incomplete information.
What systems does the performance plan cover?
Plans cover the building's base electrical infrastructure: distribution panels, breakers, lighting (fixtures we installed), controls, emergency lighting, and safety devices. Some clients add mechanical monitoring and capital planning. We scope to what is valuable to your building.
What happens if something breaks between visits?
Covered repairs on fixtures we installed are handled at no additional cost during plan hours. Non-covered repairs are priced transparently before any work starts. Plan clients get priority dispatch ahead of non-contract calls.
How long are performance plan contracts?
Standard term is 12 months with auto-renewal. Multi-year terms are available. We do not use lock-in contracts. We would rather earn your renewal every year than trap you in a commitment.
Can I start with just lighting and expand later?
Yes. Many clients start with lighting-only performance plans and add mechanical monitoring, capital planning, or utility rate analysis as the relationship proves out. The plan scales to your needs.